welcome to the Urban Flash Flooding in England Project
Overview
This page contains the outputs of a project funded by Subak to compile historic data on the impacts of recent urban flash flood events in England using information contained in newspaper reports. It aims to map these events in as much detail as possible, looking for information at street and building level.
The project uses natural language processing (NLP) techniques to detect urban flash flood events from newspaper articles, and extract the names of streets, buildings and other places affected.
The project analysed approximately 17,400 articles about flooding from around 300 newspaper websites, generating a list of 56 of the most significant dates for summertime urban flash flooding in England since 2010.
Each map presents short, standardised information on what can be understood to have occurred at each location from articles. This may include depth information, whether internal flooding occurred, etc.
Outputs
The project outputs are as follows:
• A set of 56 downloadable interactive maps of flooding impacts on each of the key dates identified (see below)
• A geoJSON file containing the data for each map
• A single geoJSON file containing the data for all maps
• A csv file providing details of each date, as well as other dates on which urban flash floods were identified as having occurred but which were not mapped due to a lack of geographical detail. Urls to relevant articles are provided for all dates, including those which haven't been mapped.
The entire set of outputs can be downloaded here, otherwise refer to the list below for individual events.
Coordinates for most of the locations in the maps and geoJSON files have been derived from OpenStreetMap. OpenStreetMap data is available under an Open Data Commons Open Database License. Consequently, Urban Flash Flooding in England project data is also available under the same conditions. You are free to use or adapt this data however you wish as long as you:
- Give appropriate credit to both ClimateNode and OpenStreetMap
- Distribute any altered or extended data only under the same licence
Documentation is here. Please direct any queries about the project to contact@climatenode.org.
| Date | Description | Map | geoJSON |
|---|---|---|---|
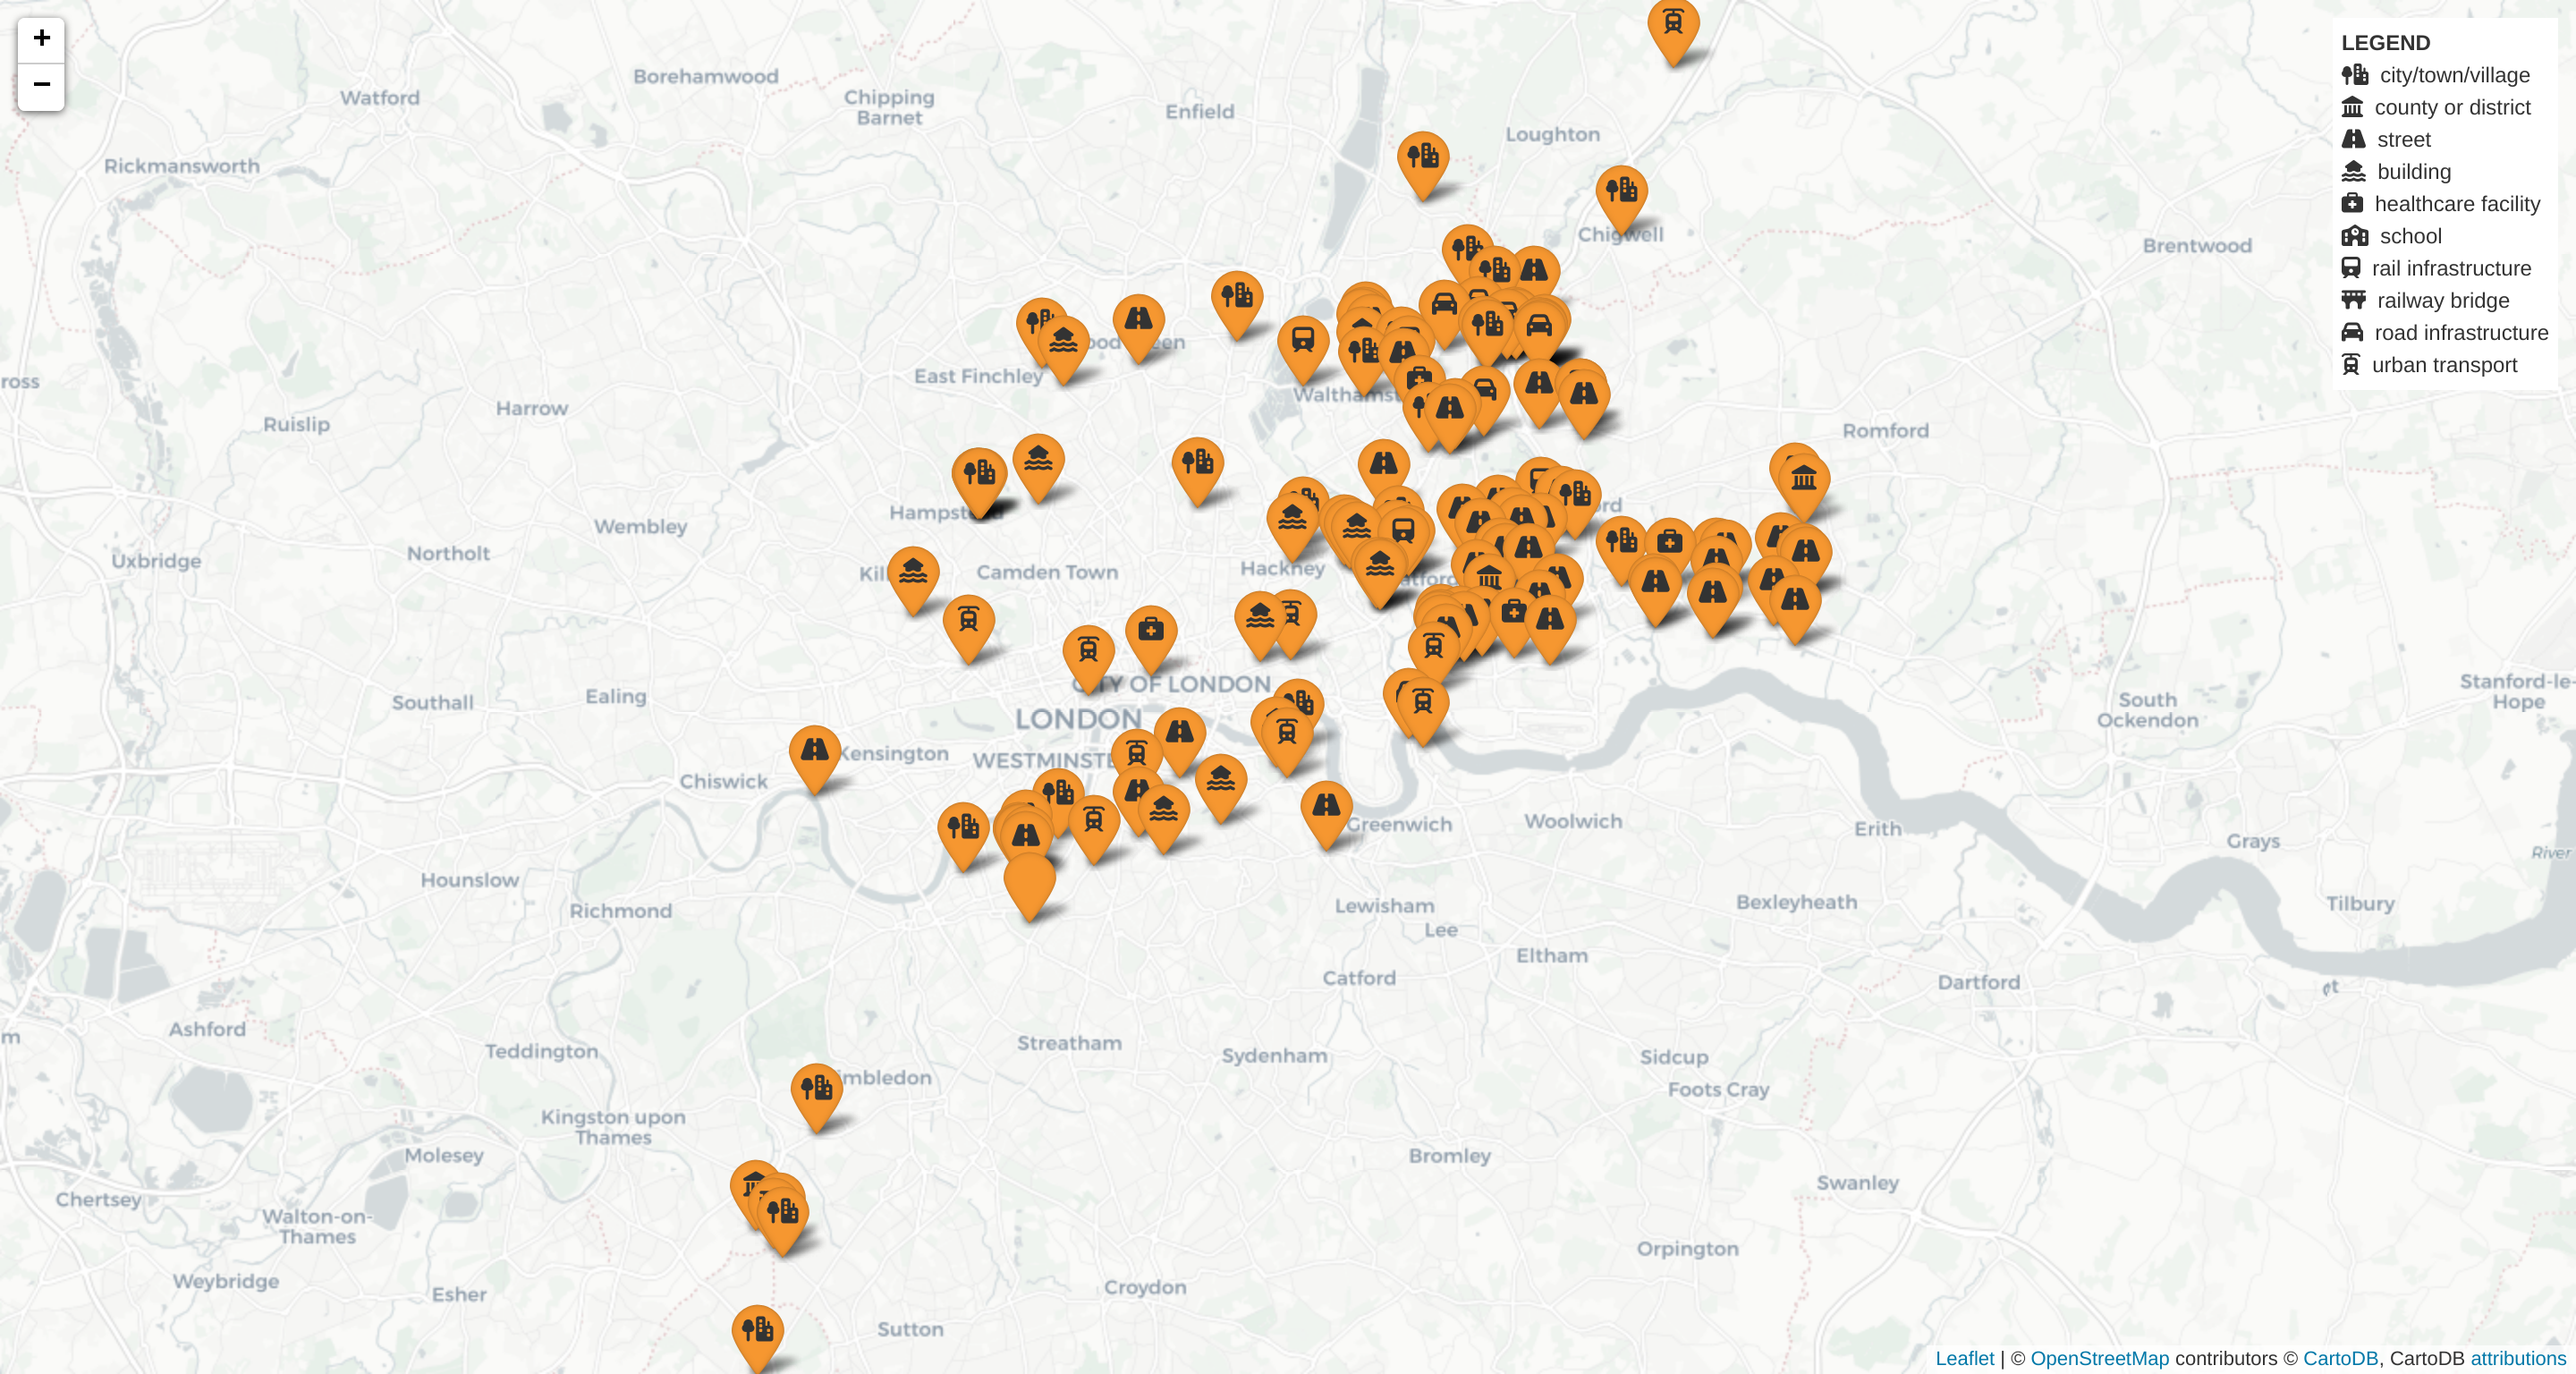
| 25/08/2022 | Flash flooding in London (with mostly transport-related impacts reported), Bury St Edmunds and Norfolk. | 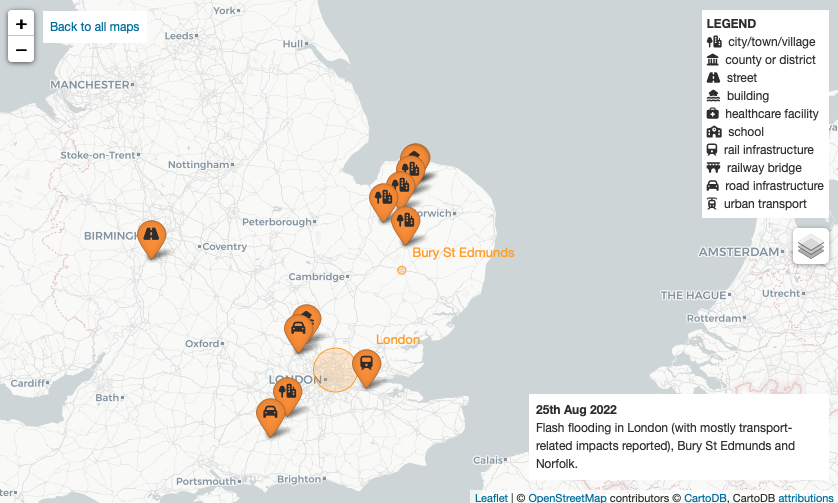 | geoJSON |
| 17/08/2022 | Flash flooding in Spalding (Lincs), Essex and London. | 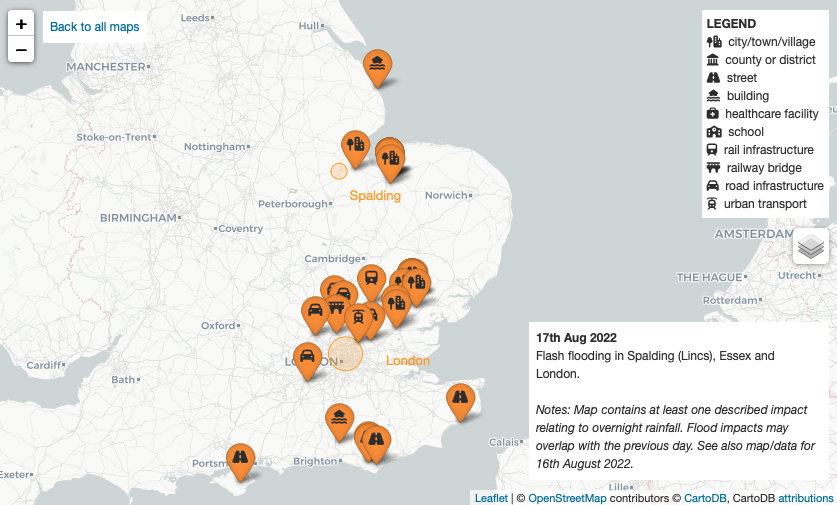 | geoJSON |
| 16/08/2022 | Flash flooding in Sheffield, Market Rasen (Lincs), Worksop, Kettering, and parts of the South West. | 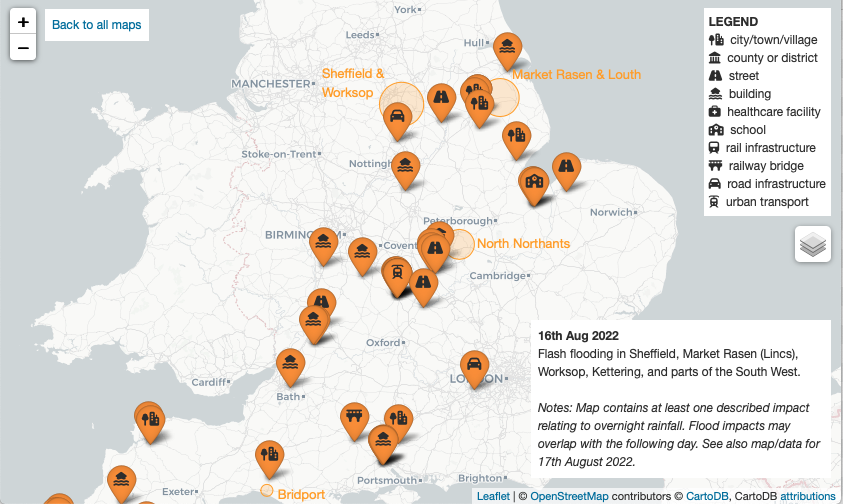 | geoJSON |
| 14/09/2021 | Some relatively minor flash flooding in London. | 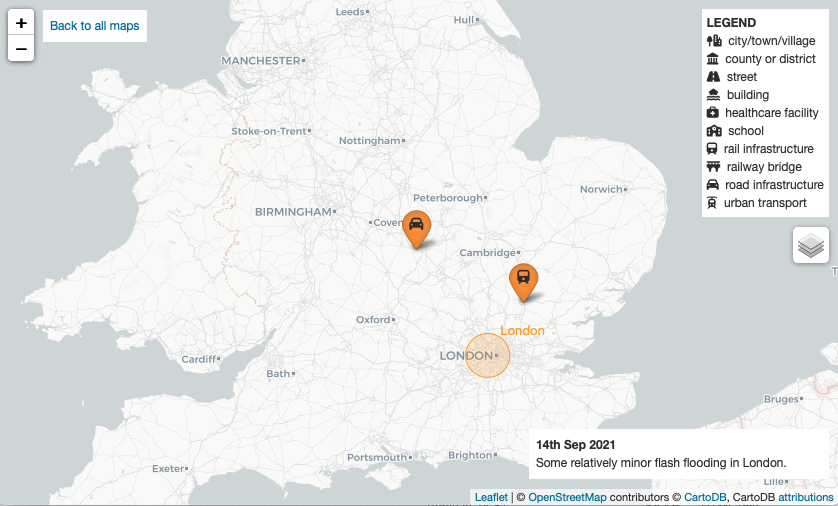 | geoJSON |
| 09/09/2021 | Flash flooding in Wirral, Blackburn and West Yorkshire; four schools affected in Mirfield, West Yorkshire. | 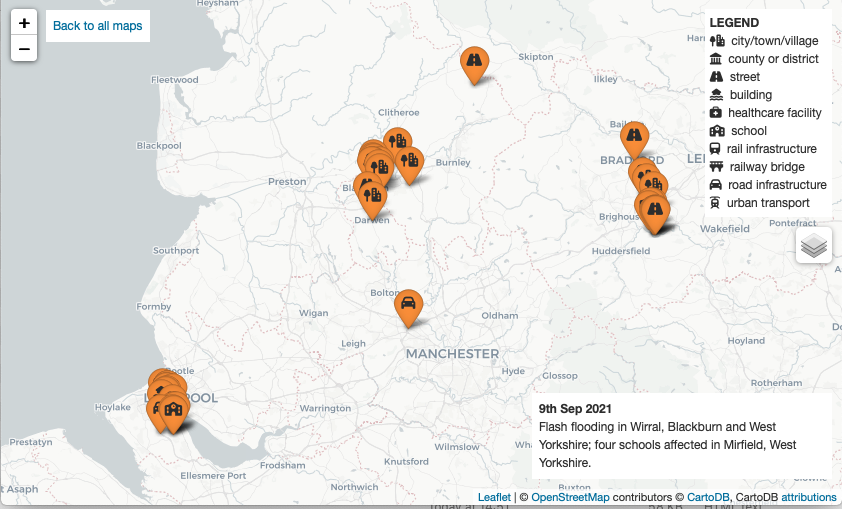 | geoJSON |
| 07/08/2021 | Flash flooding with some minor transport disruption in London | 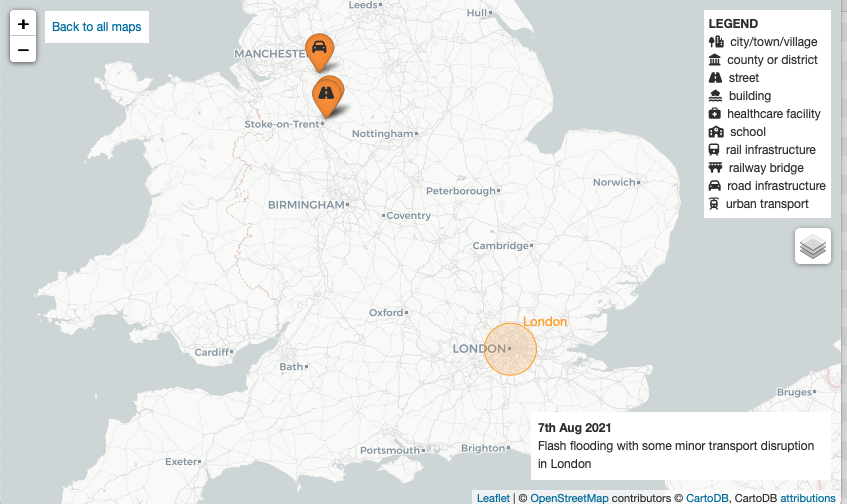 | geoJSON |
| 28/07/2021 | Thunderstorm generating some flash flooding in Warrington and Merseyside; hail in Stoke-on-Trent. | 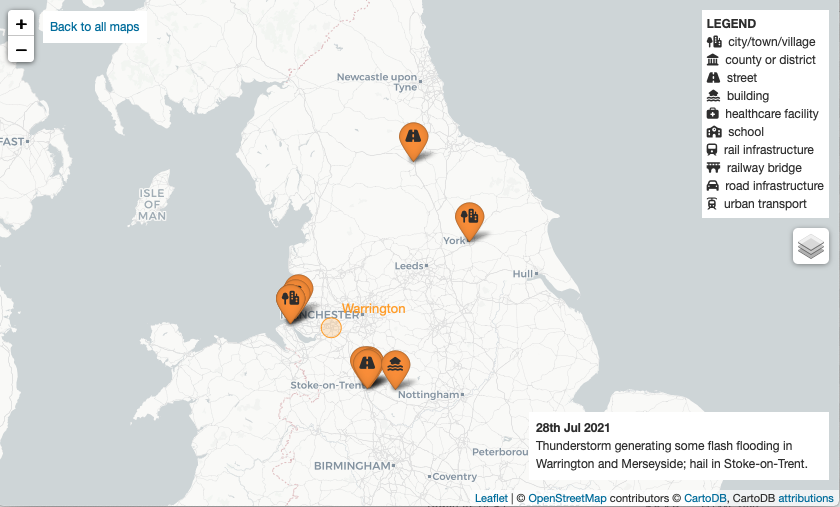 | geoJSON |
| 27/07/2021 | Flash flooding in the West Midlands and Thetford, Norfolk. | 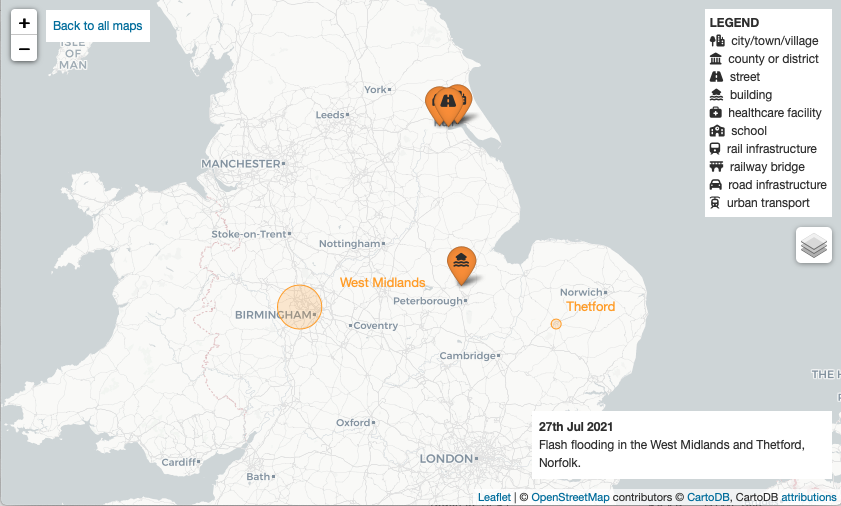 | geoJSON |
| 25/07/2021 | Severe flash flooding in London, with impacts extending into East Anglia and the Home Counties. A major incident declared after flooding affects Whipps Cross and Newham Hospitals, East London. | 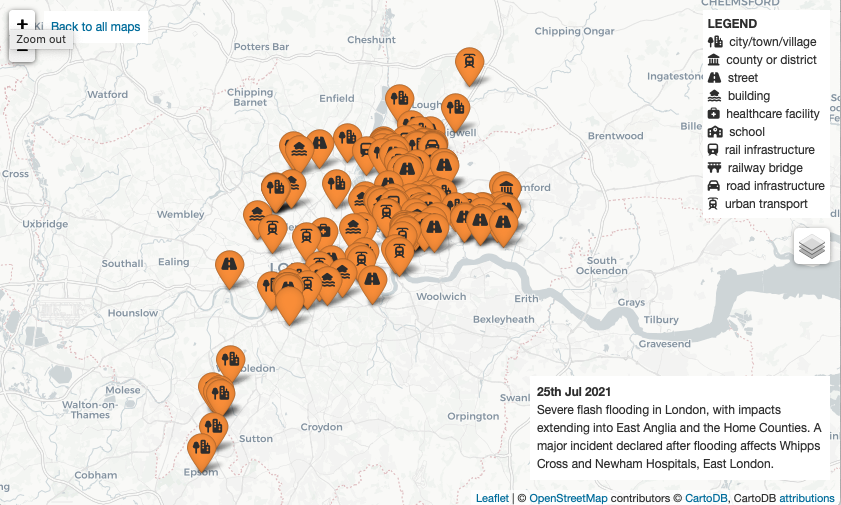 | geoJSON |
| 20/07/2021 | Some flash flooding in Kent and Bromley; hail in Leicestershire and Essex. | 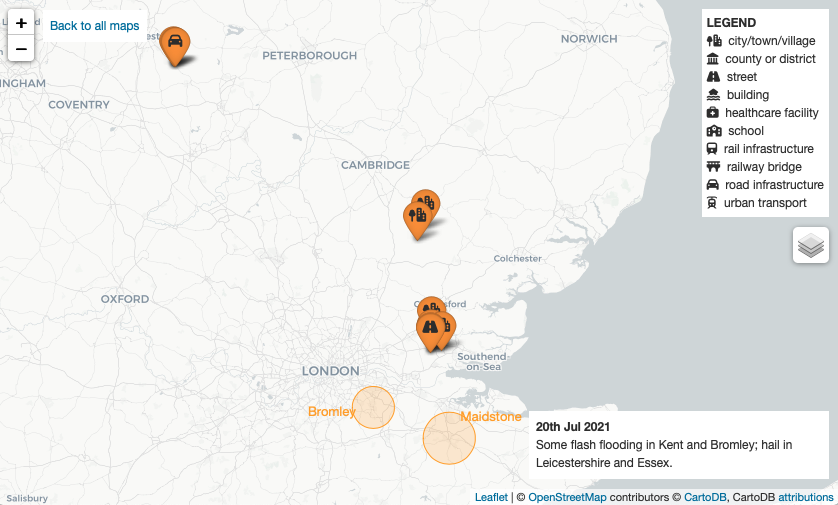 | geoJSON |
| 12/07/2021 | Severe flash flooding and sewer flooding in parts of London. Additional flash flood events in the Bournemouth area and Preston. | 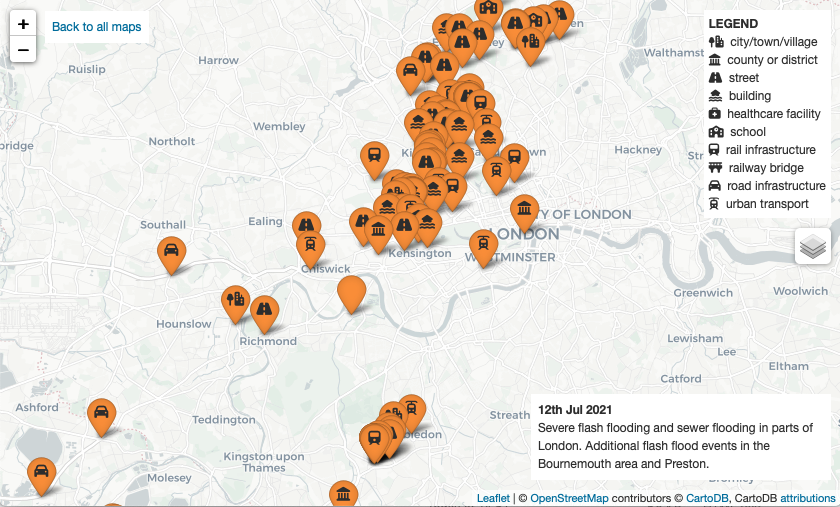 | geoJSON |
| 09/07/2021 | Flash flooding in Peterborough and Norwich, with a major incident declared in Peterborough. | 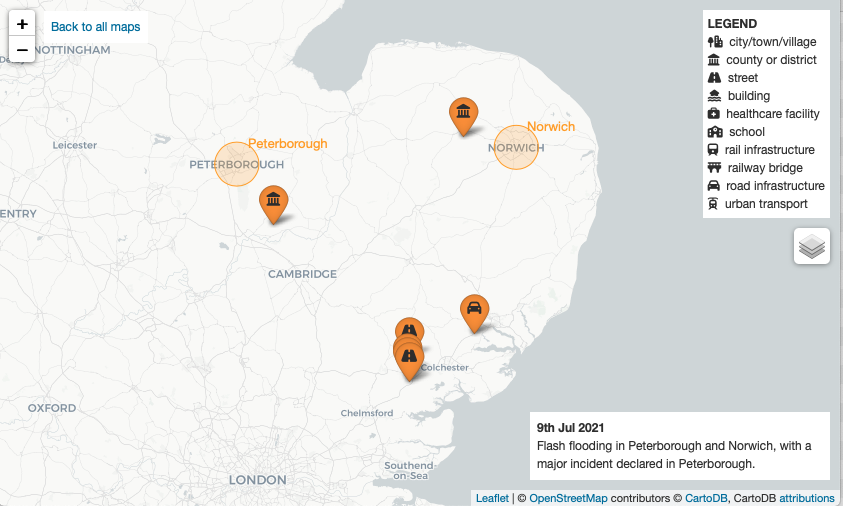 | geoJSON |
| 28/06/2021 | Severe flash flood event in Chard, Somerset. | 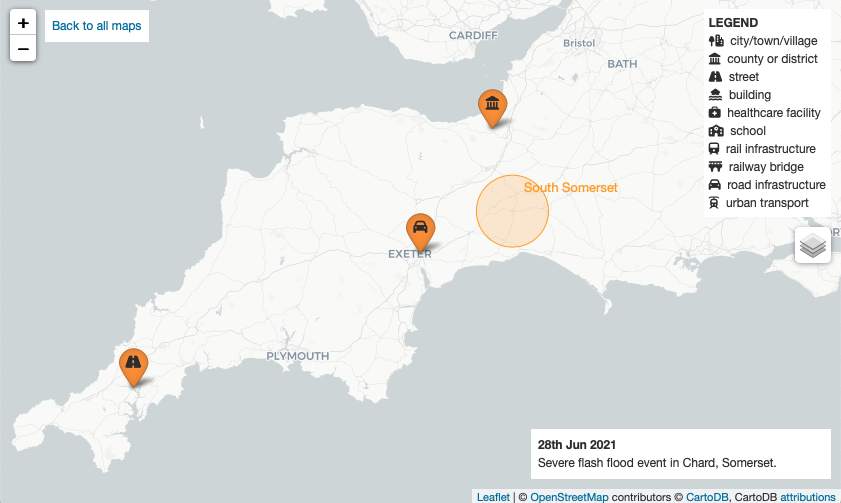 | geoJSON |
| 25/06/2021 | Severe flash flooding in Dorridge, Solihull, and Romford, East London; further flash flooding in Harwich and Felixstowe |  | geoJSON |
| 18/06/2021 | Flash flooding in Gorleston-on-Sea, Great Yarmouth, and scattered impacts in Southeast England. | 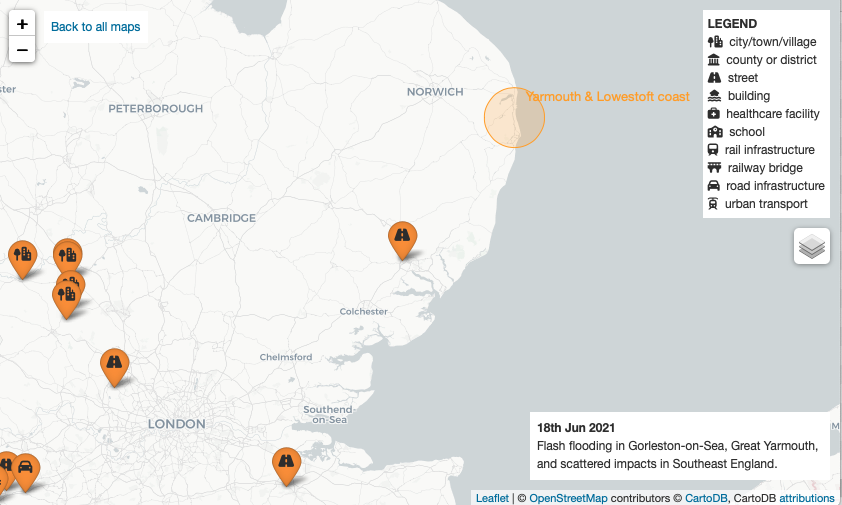 | geoJSON |
| 16/05/2021 | Flash flooding in Horwich (Bolton), Darwen and Settle. | 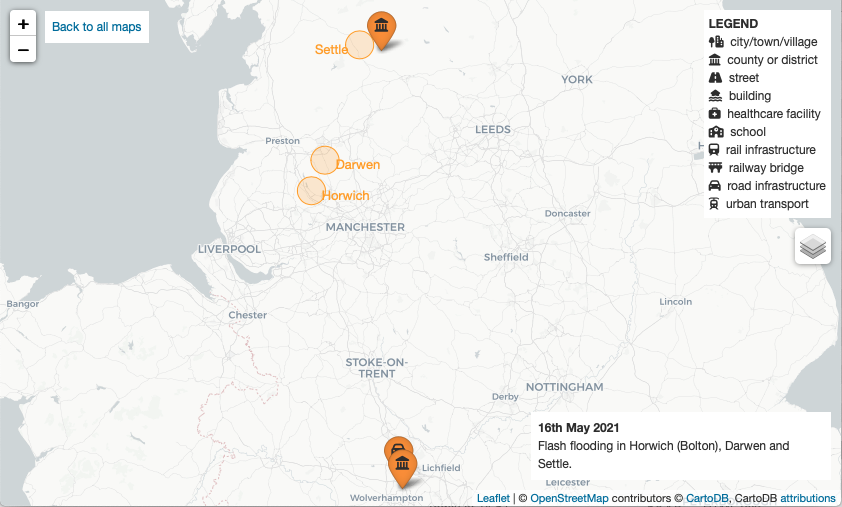 | geoJSON |
| 27/08/2020 | Long swathe of impacts reported from Cornwall to Southend, including fairly major flash flooding in Plymouth and Winchester. | 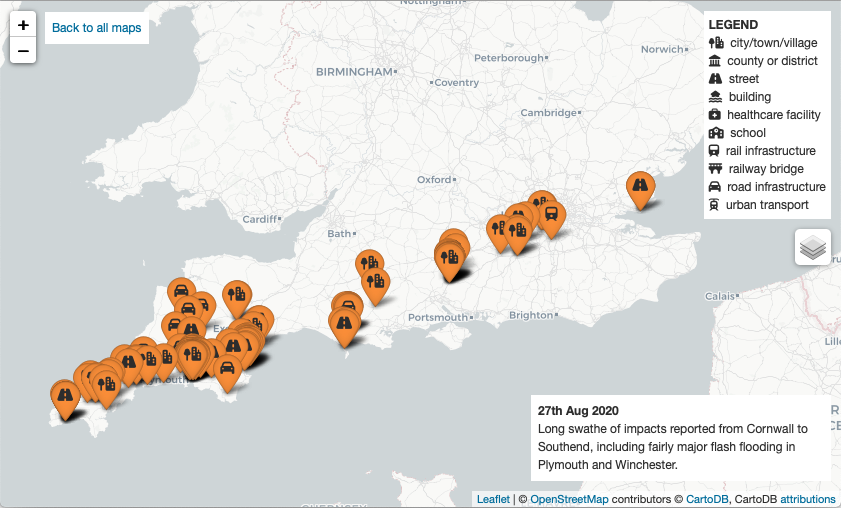 | geoJSON |
| 17/08/2020 | Flash flooding in Barnstaple, Exeter, Market Rasen (Lincs) and Loughton (Essex); particularly severe event in Barnstaple. | 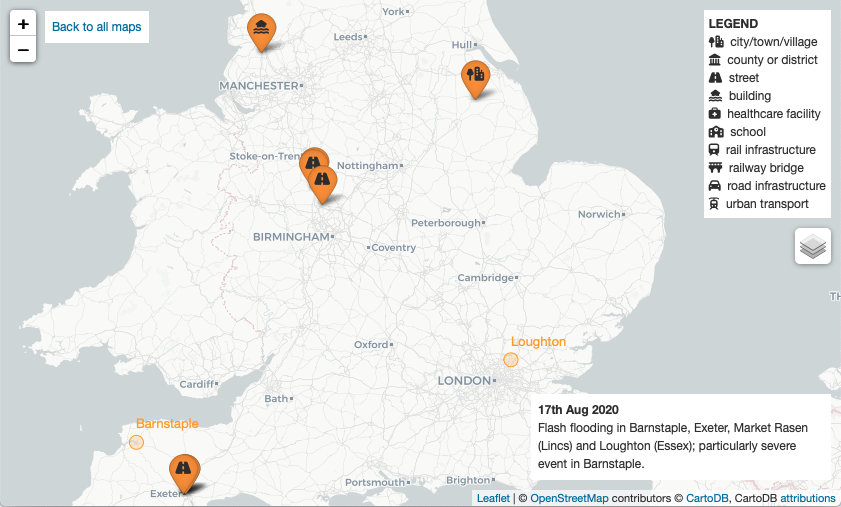 | geoJSON |
| 16/08/2020 | Extreme rainfall recorded in Breckland, Norfolk, with local flash flooding impacts. Severe flash flooding in Wellingborough, Northamptonshire. Further impacts in Bury St Edmunds, Sheringham and elsewhere. | 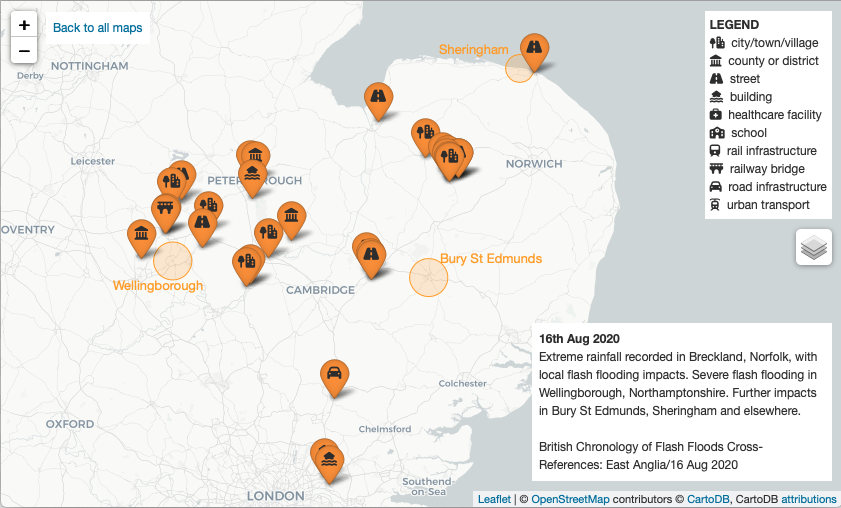 | geoJSON |
| 15/08/2020 | Flash flooding in Havering, Chelmsford and Sittingbourne. | 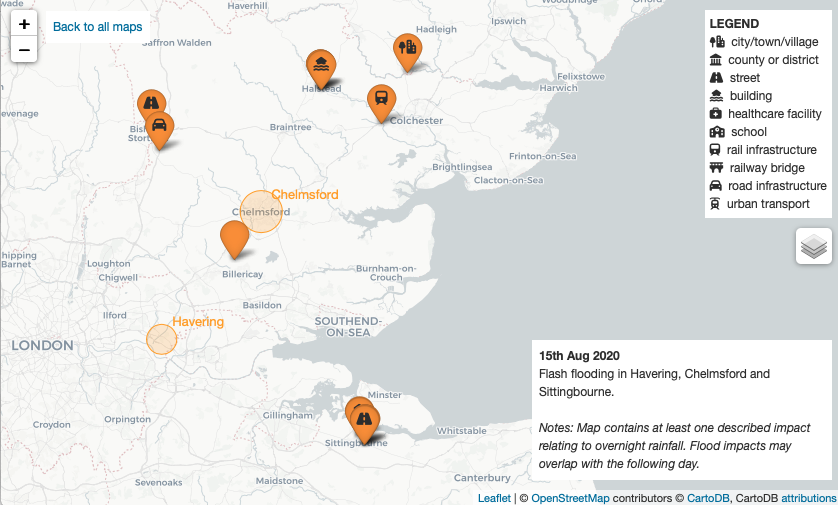 | geoJSON |
| 13/08/2020 | Significant flash flooding in Croydon, South London, and northern Surrey, as well as numerous other relatively isolated incidents. | 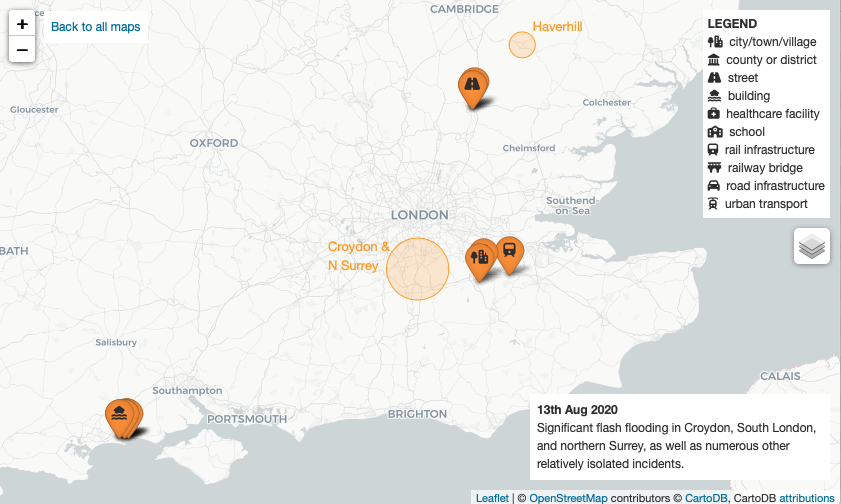 | geoJSON |
| 12/08/2020 | Flash flooding in the West Midlands, Cheshire and Hertfordshire | 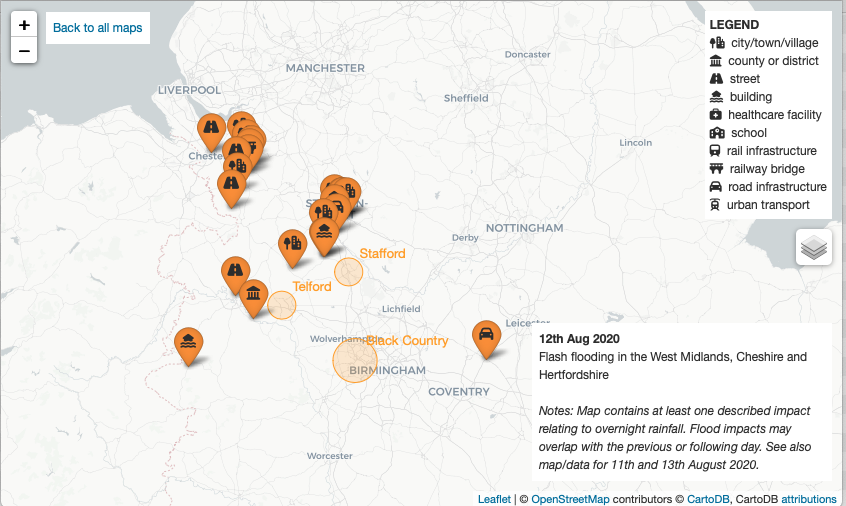 | geoJSON |
| 11/08/2020 | Flash flooding in Lancashire | 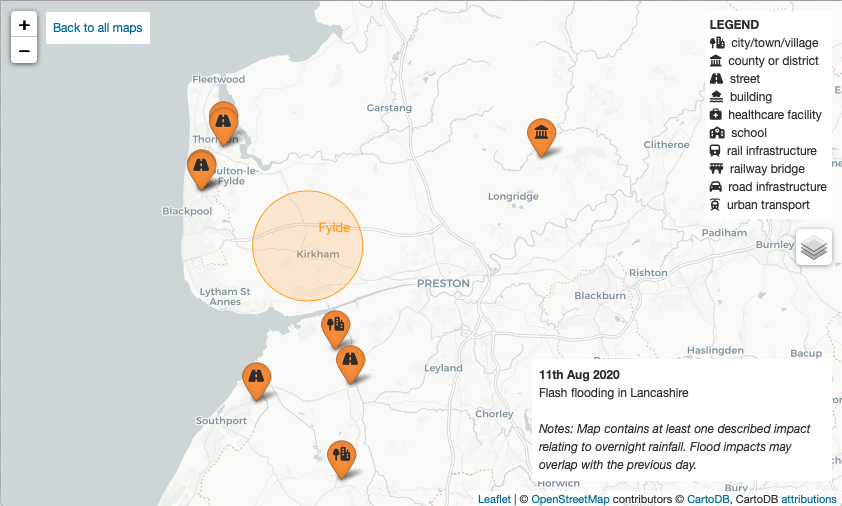 | geoJSON |
| 17/06/2020 | Flash flooding in Crewe, Ilkeston (Derbyshire), Downham Market (Norfolk), and the South West | 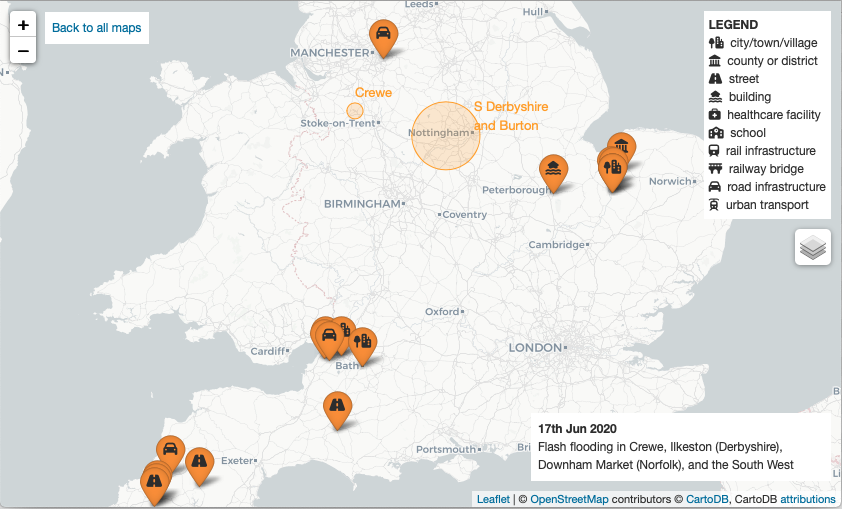 | geoJSON |
| 16/06/2020 | Severe flash flooding in South Liverpool, Blackburn and Darwen, parts of the West Midlands, and Nailsworth (Gloucestershire); further flash flooding in Greater Manchester. | 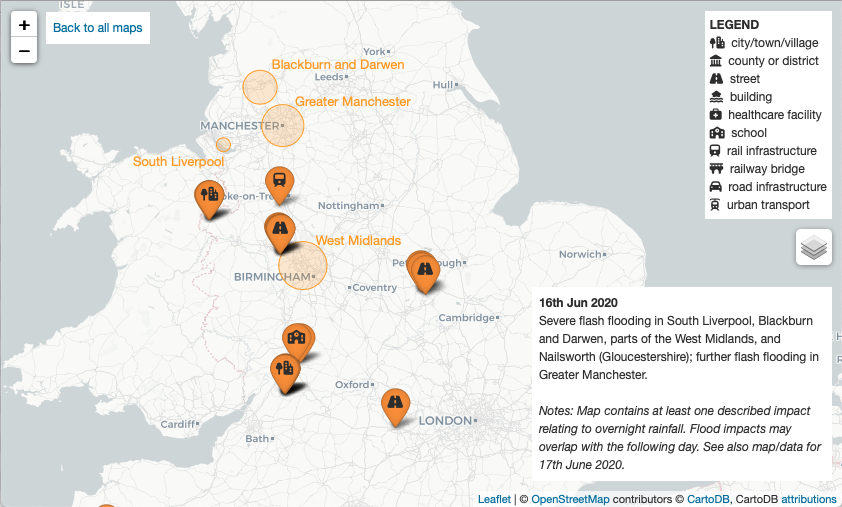 | geoJSON |
| 15/06/2020 | Damaging flash flooding in Rochdale; further flash flooding elsewhere in Greater Manchester, as well as in Northwich, Cheshire. | 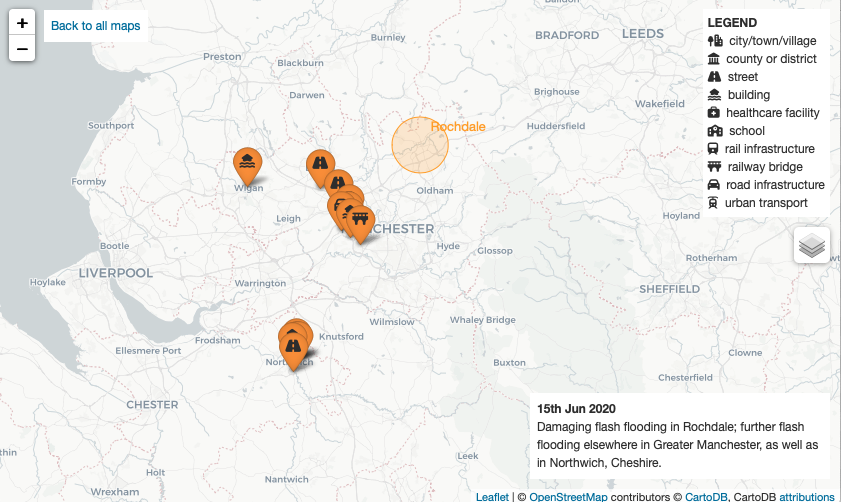 | geoJSON |
| 24/09/2019 | The remnants of Hurricane Humberto cause some flash flooding in Merseyside, the West Midlands and Home Counties, as well as Tube and rail station flooding in London. | 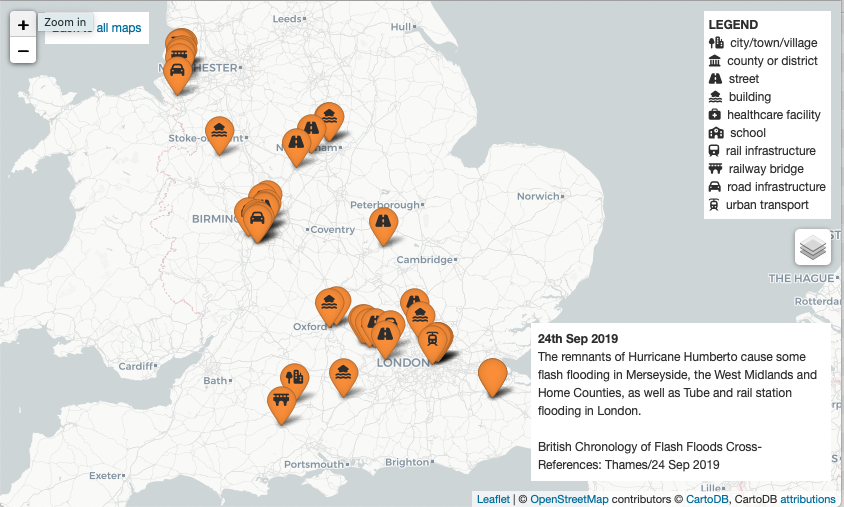 | geoJSON |
| 31/07/2019 | Flooding in Stockport, Buxton and Cheshire; major incident in Poynton, Cheshire. | 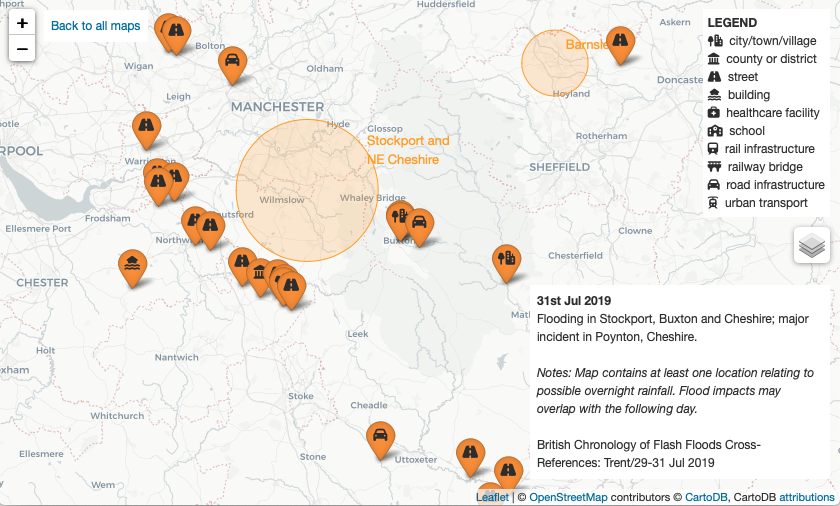 | geoJSON |
| 30/07/2019 | Flash flooding in the West Midlands. Major rural flash flood event in the Yorkshire Dales. | 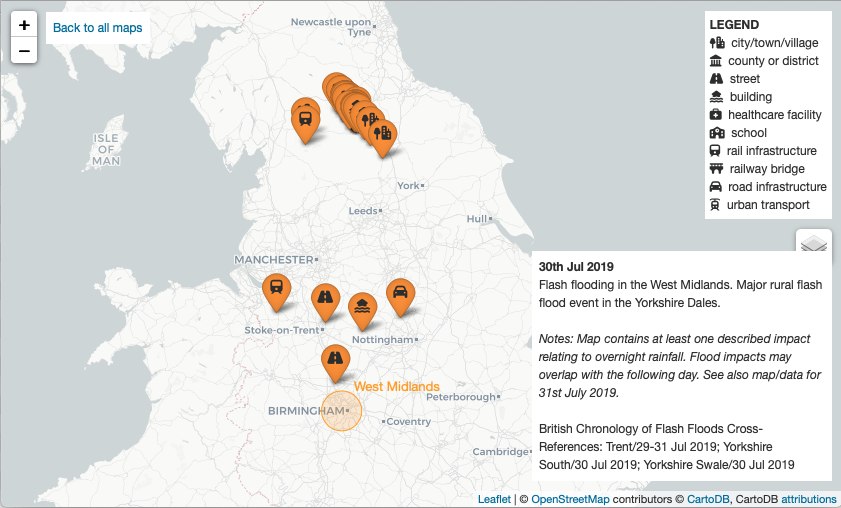 | geoJSON |
| 28/07/2019 | Flash flooding in Greater Manchester, West Yorkshire, Cheshire and Preston | 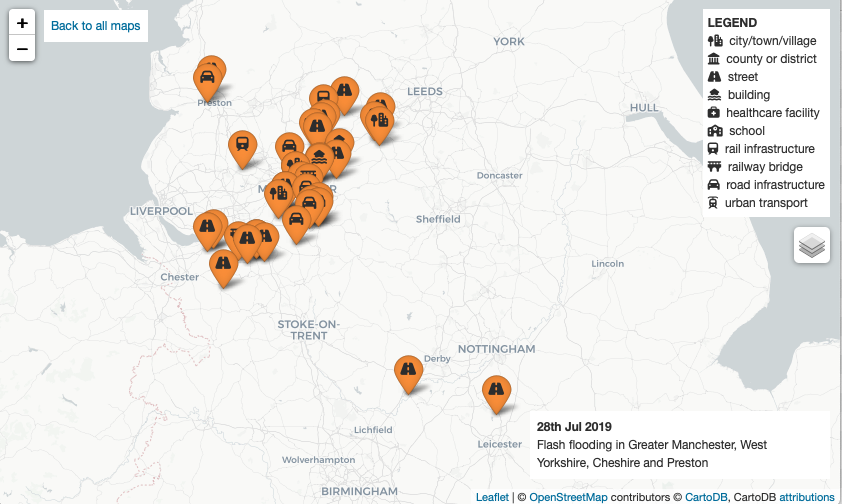 | geoJSON |
| 12/06/2019 | Flood impacts in Chester, Merseyside and Southwell, Nottinghamshire. | 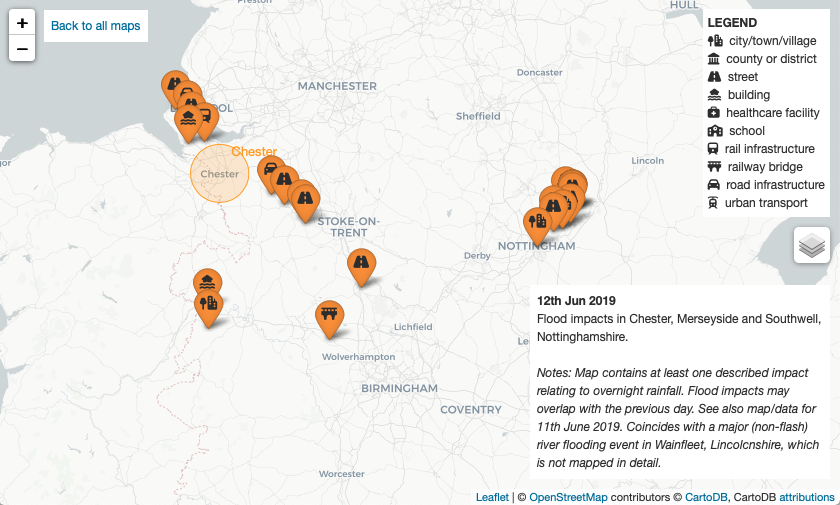 | geoJSON |
| 11/06/2019 | Flood impacts distributed throughout towns and villages in Lincolnshire, with problems for many of the affected areas' schools | 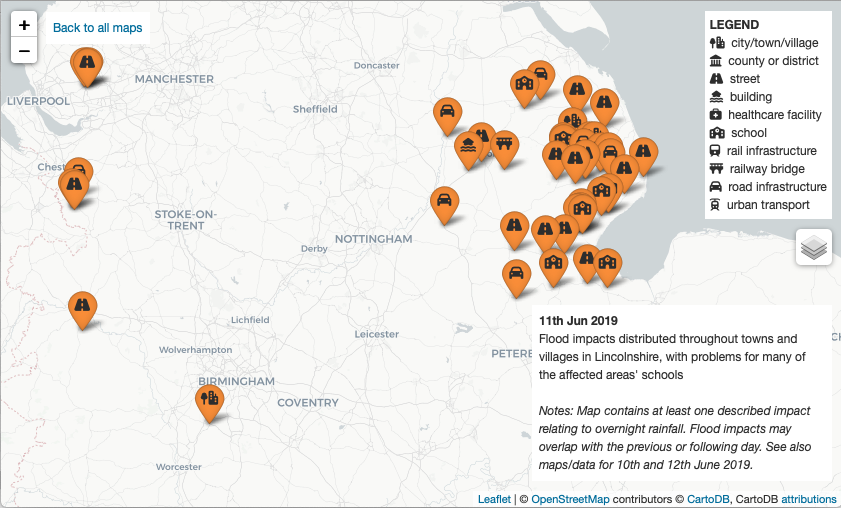 | geoJSON |
| 10/06/2019 | Flash flooding in Kent with some isolated impacts in South London. | 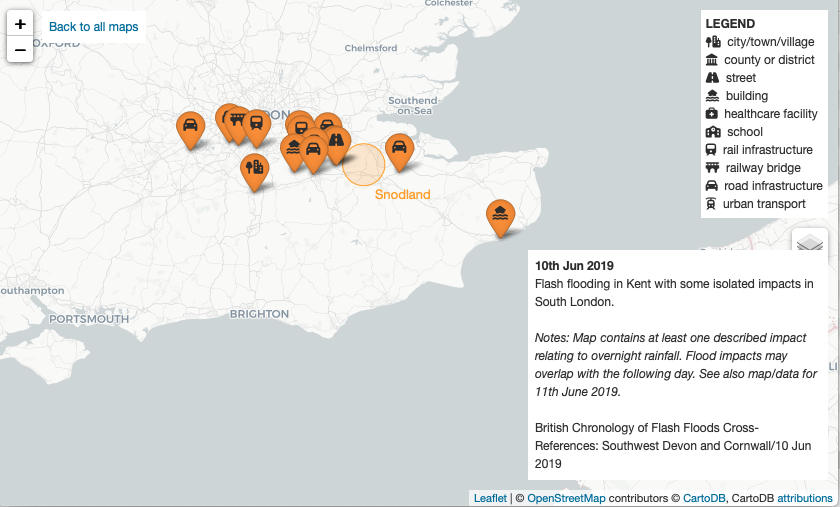 | geoJSON |
| 31/05/2018 | Flash flooding in West Sussex, Oxfordshire and Bristol | 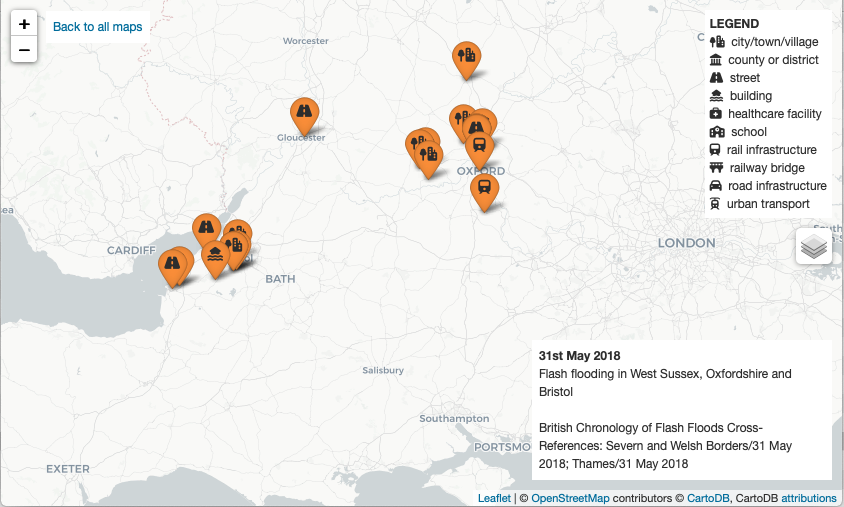 | geoJSON |
| 29/05/2018 | Flash flooding in Kent and East London. | 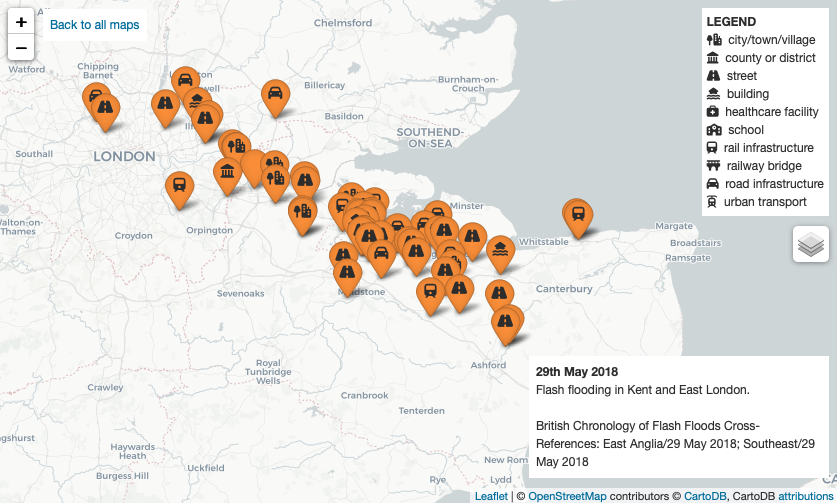 | geoJSON |
| 27/05/2018 | Flash flooding in the West Midlands, Northampton and Croydon. | 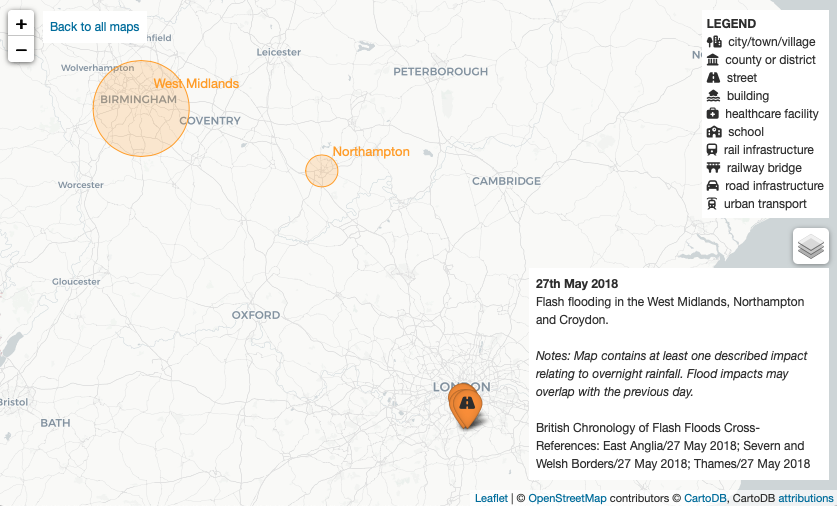 | geoJSON |
| 03/09/2017 | Flash flooding in Cornwall and Plymouth | 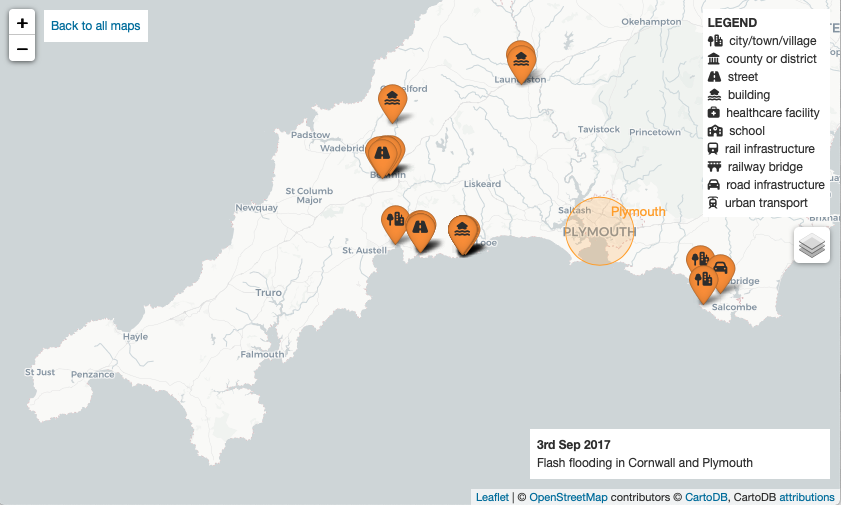 | geoJSON |
| 23/08/2017 | Flash flooding in West Yorkshire and Scarborough | 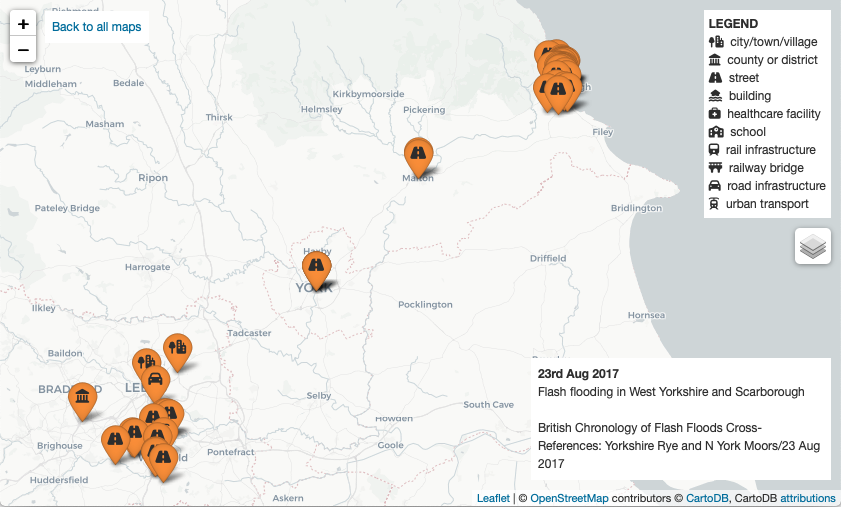 | geoJSON |
| 25/07/2017 | Extremely localised flash flooding in Gloucester. | 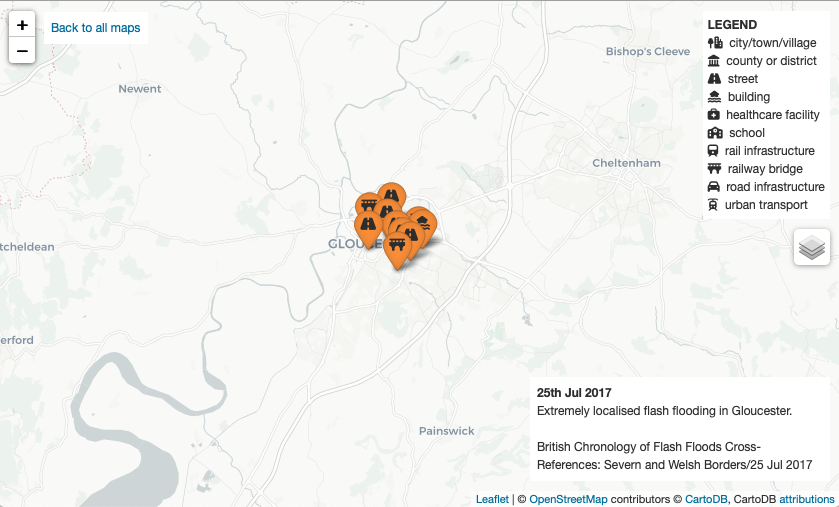 | geoJSON |
| 23/07/2017 | Flash flooding in Ilminster, Somerset, and some minor surface water flooding in Bristol. | 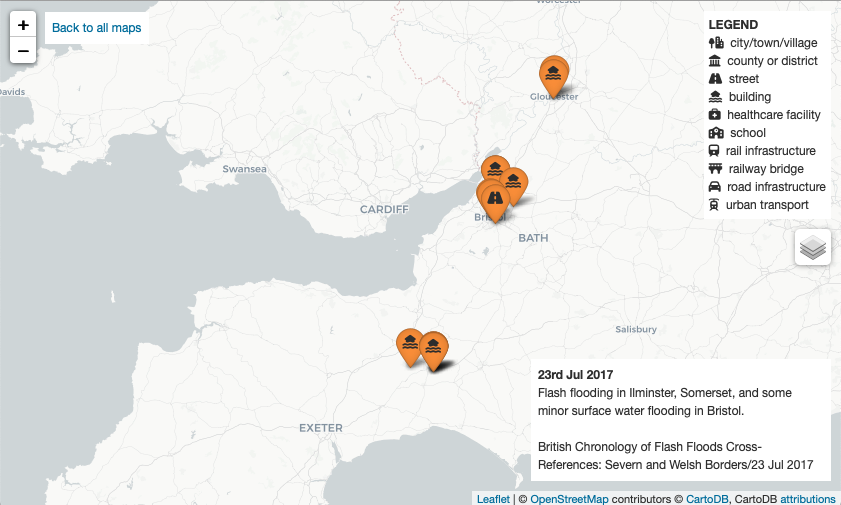 | geoJSON |
| 16/09/2016 | Flash flooding in Hertfordshire and Surrey. | 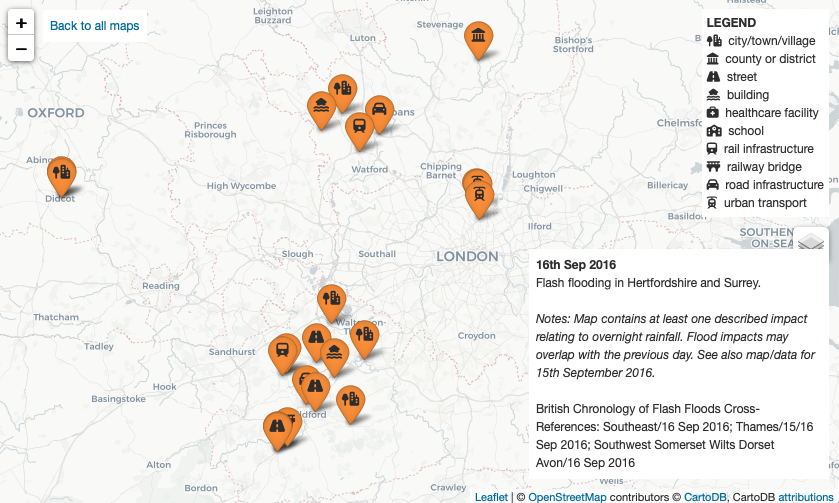 | geoJSON |
| 15/09/2016 | Flash flooding in Harrow and Hillingdon, North London. | 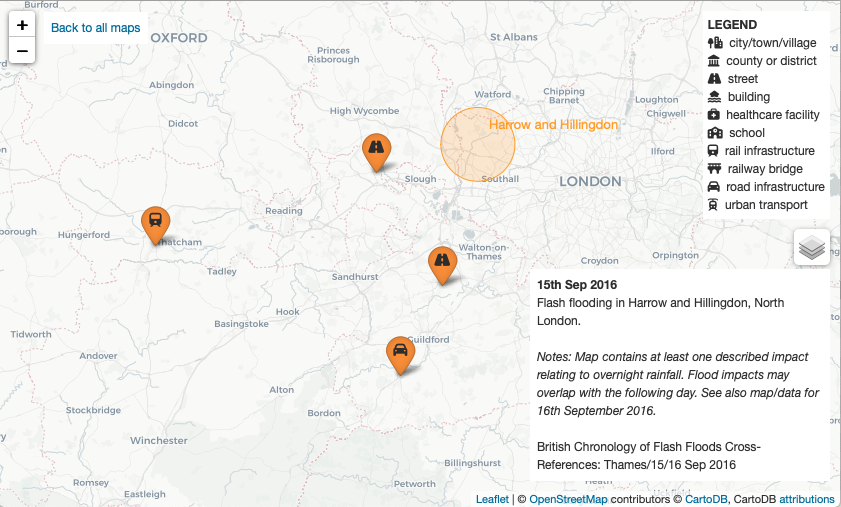 | geoJSON |
| 13/09/2016 | Heavy thunderstorm in Greater Manchester | 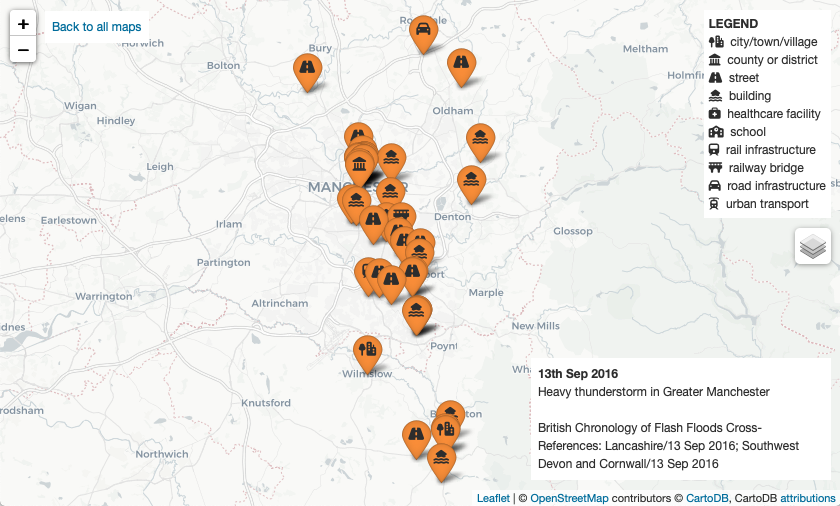 | geoJSON |
| 23/06/2016 | Flash flooding in London, Colchester and Surrey. | 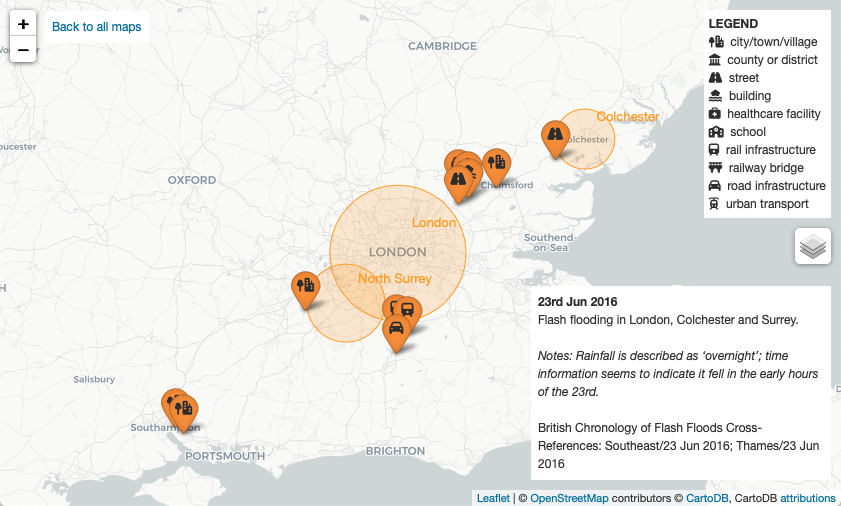 | geoJSON |
| 16/06/2016 | Major flash flood event in the West Midlands; further flash flooding in Skelmersdale (Lancashire) and Cheshire. | 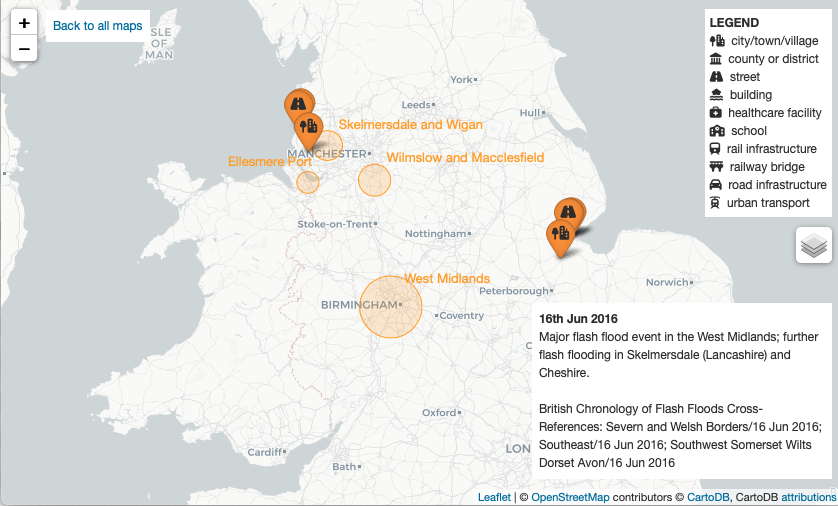 | geoJSON |
| 14/06/2016 | Flash flooding in the West Midlands and Ellesmere Port. | 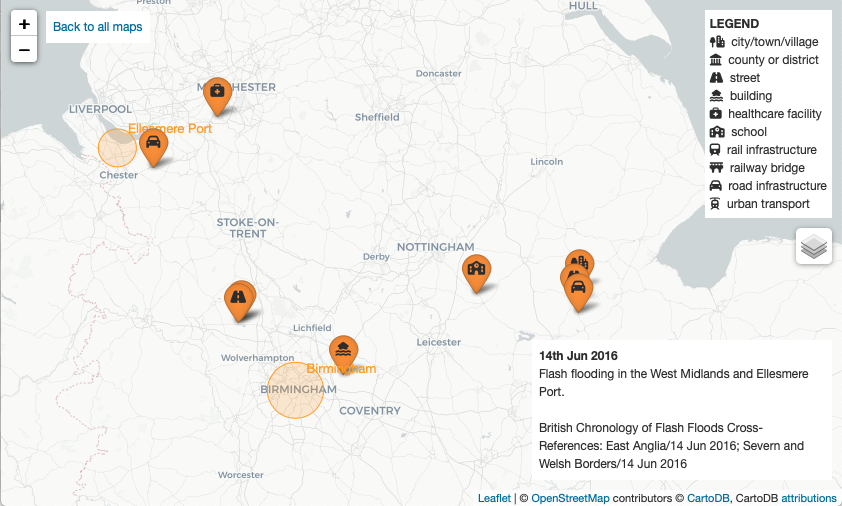 | geoJSON |
| 11/06/2016 | Flash flooding in Stockport and Chester | 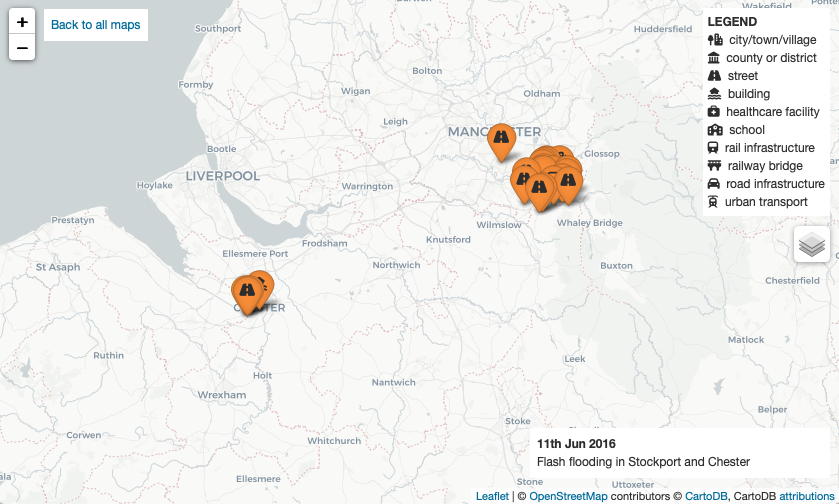 | geoJSON |
| 10/06/2016 | Flash flooding in Liverpool, Ellesmere Port and Cannock, Staffordshire. | 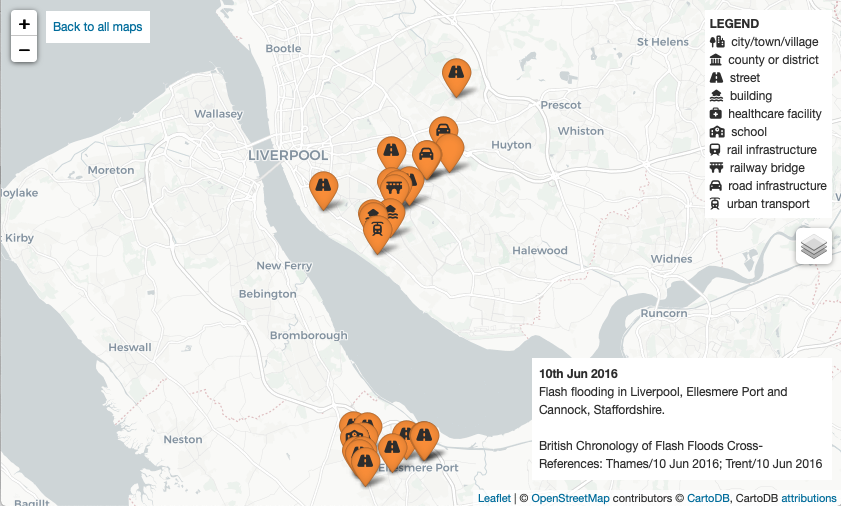 | geoJSON |
| 08/06/2016 | Major flash flooding event in the West Midlands with multiple school closures; also in Greater Manchester and London. | 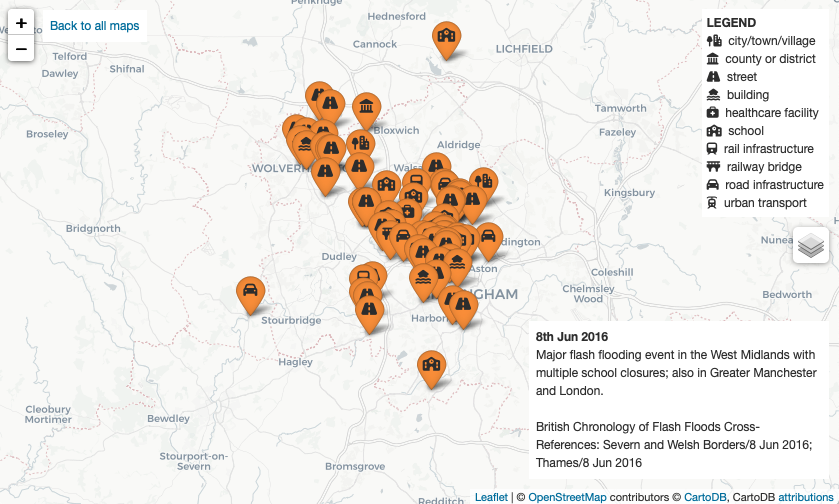 | geoJSON |
| 07/06/2016 | Flash flooding in South London, Caterham (Surrey), Milton Keynes and Portslade near Brighton. | 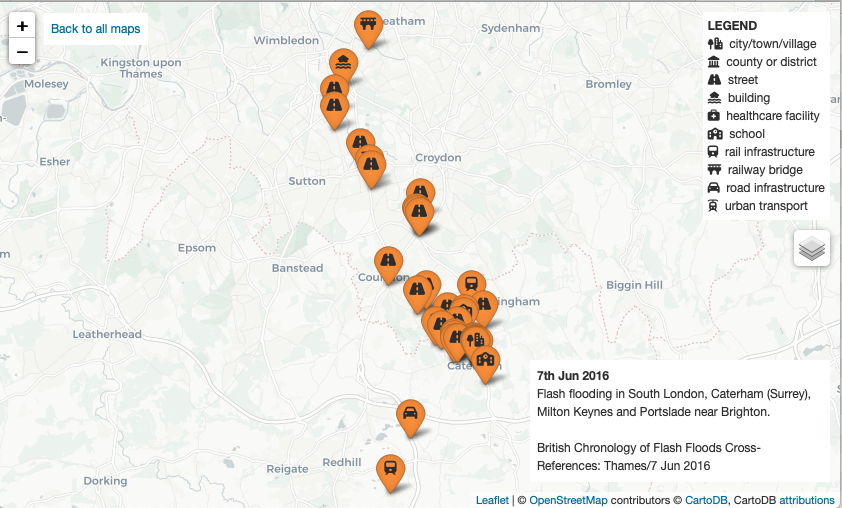 | geoJSON |
| 11/05/2016 | Flash flooding in Woking | 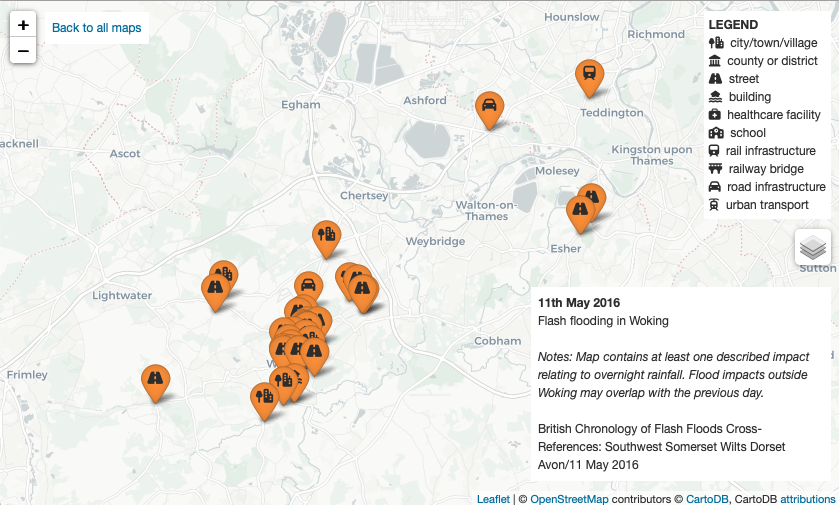 | geoJSON |
| 28/07/2014 | Flash flooding and transport disruption in Hillingdon, Northeast London, as well as some flooding in Thaxted, Essex. | 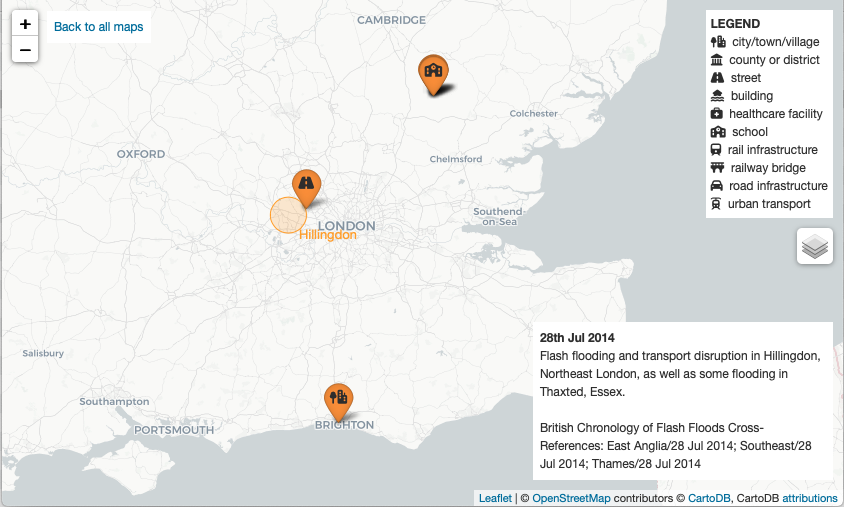 | geoJSON |
| 20/07/2014 | Severe flash flood event on Canvey Island, Essex, with further impacts throughout the Thames Estuary. | 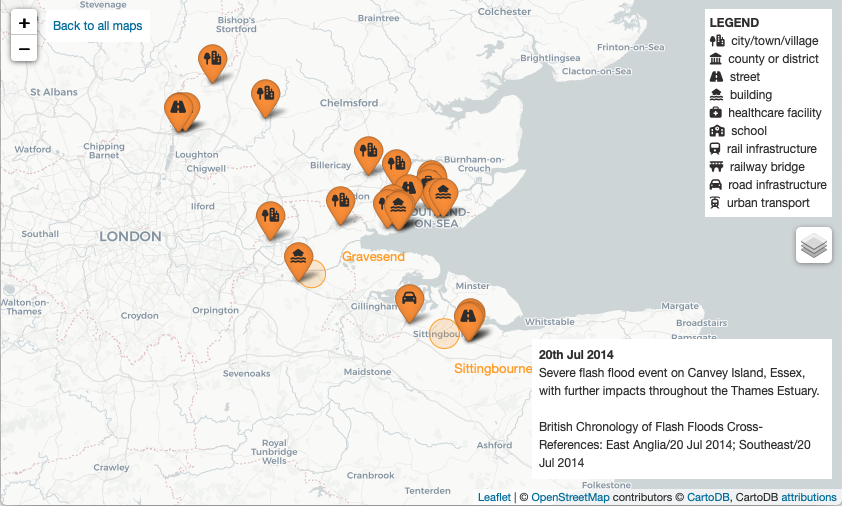 | geoJSON |
| 24/08/2013 | Flash flooding in Southend and other parts of South Essex | 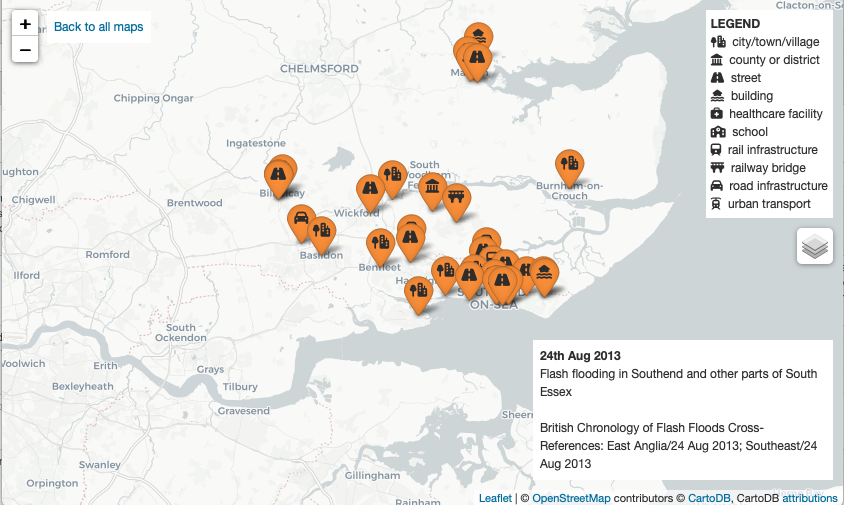 | geoJSON |
| 28/06/2012 | Severe flash flooding in Tyneside (‘The Great Tyneside Storm’ or ‘Toon Monsoon’). Additional flash flooding in the West Midlands and a hailstorm in Leicestershire. | 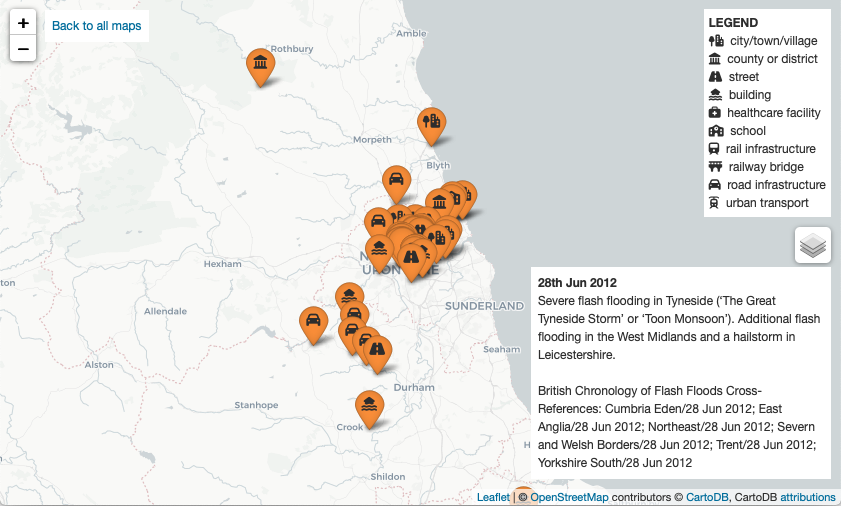 | geoJSON |
| 18/08/2011 | Flash flooding in Bournemouth and Hampshire | 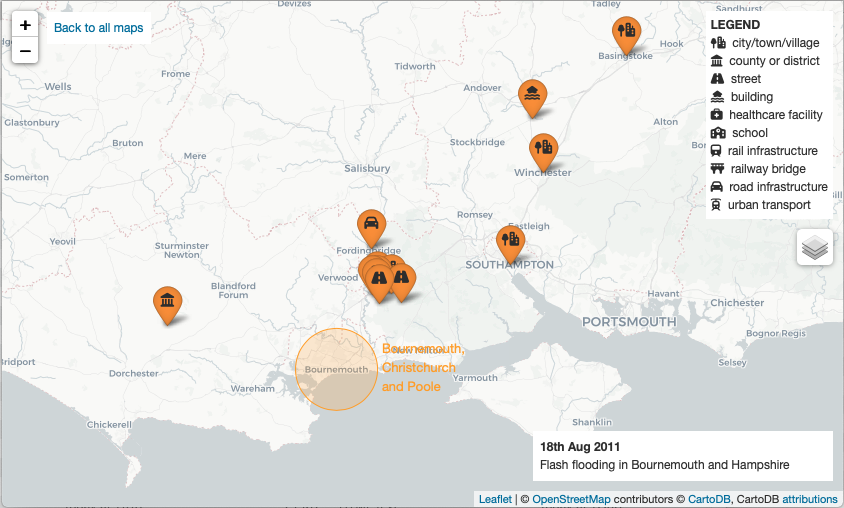 | geoJSON |
Notes
The criteria for whether a map has been generated for a particular date are:
- it falls between May and September (inclusive)
- flash flooding due to heavy rainfall occurred in at least one town or city which can be mapped in detail (although towns/cities for which there is less detail, as well as rural areas, are also presented)
The focus of the project is on surface water flooding, although some events also involve fluvial flooding, and/or in some locations the type of flooding may not be clear.
The methodology uses only articles which are currently online. There are likely many relevant articles since 2010 which are no longer available online, e.g. because a newspaper has been taken over, and unfortunately it has not been possible to include this information. The volume of relevant articles with sufficient detail available online declines significantly prior to around the middle of the last decade. Users are referred to the British Chronology of Flash Floods for further sources of information.
Using the maps
Each piece of information presented in a marker popup has a hyperlink or hyperlinks to its source(s).
IMPORTANT: treat marker coordinates with caution. Popups present information linked to the geographical entity or approximate location mentioned in the header, not necessarily the coordinates of the marker. The exceptions to this are:
- Two asterisks ** indicates ‘true coordinates’: references to junctions, buildings etc., or images, have been used to identify where the flooding occurred fairly precisely
- One asterisk * indicates ‘approximate coordinates’: information in the article has allowed an approximate location to be identified, for example a section of a street between two reference points
Map dates reflect the date of the event, not the publication date of articles. When attributing flooding impacts to a date, the intention is to attribute the impact to the rainfall which occurred on that date. For example, if a flood impact is discovered on a Monday but due to rainfall which happened on Sunday evening, the impact is placed on the map for the Sunday. Where this is ambiguous because of overnight rainfall, this is indicated via a quality flag.
Quality flags, such as whether there is some uncertainty over the date or location of the impact, are presented between square brackets [].
Some articles describe more than one event. Every effort has been made to ensure information included on each map is relevant to the given date.
In some articles, users may need to click through a photo gallery or watch a video to find a reference to the place mentioned.